Process optimization - Procedure
Historical process data contain vital information about process operations, throughput variations, quality, energy use and failures. We use advanced analytics to unlock and use this information for optimization purposes.
Our optimization procedure combine advanced machine learning techniques, high performance computing and hands-on experience to deliver process optimization with bottom line benefits such as
- Reduce uncertainty and risk
- Improve product quality
- Increase production yield
- Reduce waste, energy consumption and emissions
- Speed up product qualification and time to market
We use optimization algorithms with self-learning capacities which enables us to create mathematical model representations of complex processes. Our mathematical models learn the non-linear relation between process inputs and outputs from existing process data.
We identify the critical drivers of process quality and deliver a full dynamic multivariate optimization solution to best meet the process objective. The model calculates the optimal process settings based on the critical input drivers.
Our team of Chemical and Applied Mathematics Engineers can apply our optimization procedure to any process with recordable inputs and outputs.
We can optimize new processes with few process data points or existing processes with large scale data storage. We can optimize a single process or multiple serial linked processes.
Process optimization - Results
Although we use highly complex mathematical modelling techniques we always deliver optimization results that are easy to understand and can be applied to ensure operational and financial benefits.
We identify the critical drivers of long term and short term output variations. This provides a fully dynamic optimization solution, which deals with the daily process variations.
The optimization solution can be delivered as an integrated part of the production units or as a database of optimal process settings. The database is accompanied by a user-friendly interface which can show the optimal process settings based on the key process inputs.
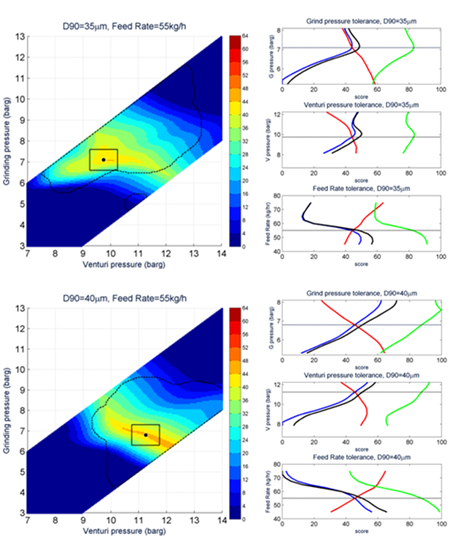
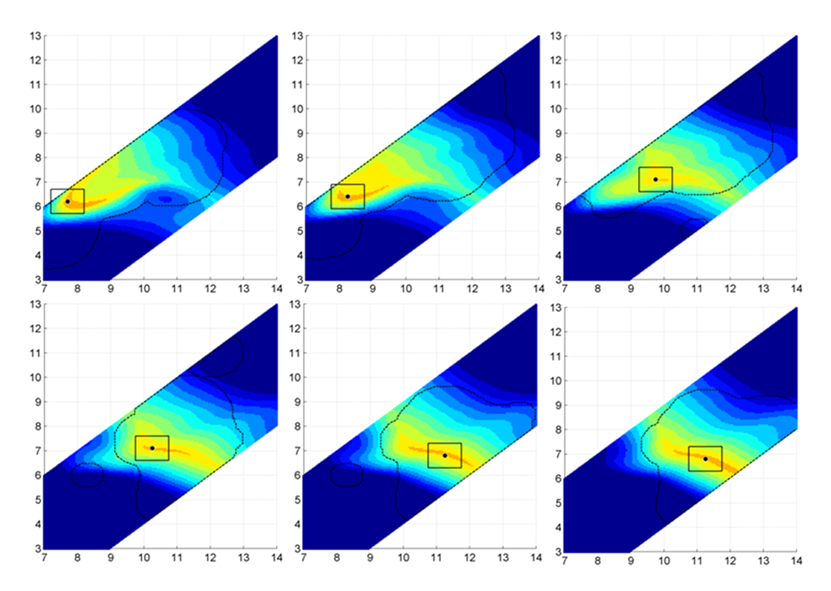
Optimal process settings are presented along with performance plots and graphs that provide valuable information about the process.
We can quickly update the mathematical models and the database when future process data becomes available.
Process optimization - Testimonial
“When dealing with a complex system with several operating parameters, that are also interdependent, we were previously (to some extent) forced to rely on "gut-feeling" or use comprehensive statistical analysis that requires a PhD in statistics to understand. This is no longer the case.”
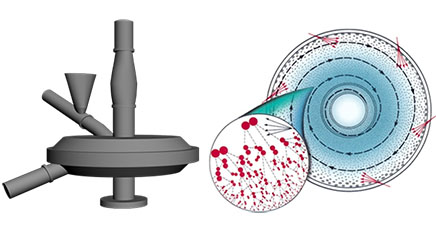
“Now we use a predictive mathematical model developed by KA Engineering to optimize the operating parameters for a micronization process. The output from the mathematical model is a great way of visualising the operating ranges, and the limitation of our process. It has brought us a much more sophisticated understanding of our process and is an excellent way of storing and using our process experiences, independently of the people involved.”
Michael Folkmann | API specialist | Leo Pharma, 2014
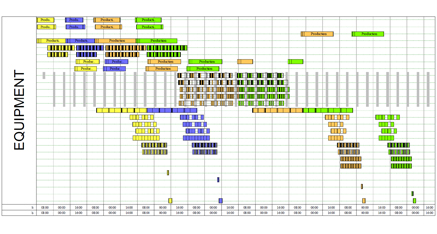
Process optimization - SchedulePro
SchedulePro is a finite capacity scheduling (FCS) tool for batch and semi-continuous manufacturing processes. We use SchedulePro for the following applications:
- Production Scheduling
- Capacity Analysis
- Plant Debottlenecking
- Cycle Time Reduction
- Modeling of Multi-Product Facilities
Process optimization - Cost estimation using Monte Carlo simulations
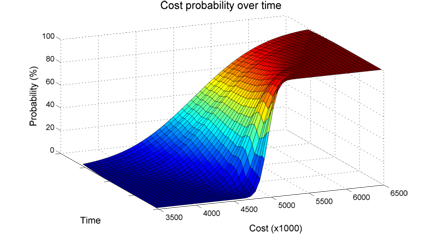
We provide project cost estimations though out a project life cycle which take into account the uncertainty of unit cost, number of units and engineering cost. Using Monte Carlo simulations we can provide cost statistical measures such as expected max, min, average and 95th percentile project cost. The uncertainty of the cost to completion is usually reduced through the project as the cost variables become more certain. This is illustrated in the figure where the s-curved cost probability function becomes steeper as time passes.
 Tel: (+45) 30 69 49 24
 ka@kaengineering.dk
 Guldagervej 33, DK-2720 Vanløse